Suomi.fi Maps – user guide
In the Suomi.fi Maps service, you can make your own map publications using the service’s map layers, as well as your own objects and any datasets in your organisation’s interface. You can add the map publications prepared to your organisation’s website.
You can change your password at https://idmservice.nls.fi.
How to use the map and create your own data
In the Suomi.fi Maps service, you can make your own map publications using the service’s map layers, as well as your own objects and any datasets in your organisation’s interface. You can add the map publications prepared to your organisation’s website.
The Suomi.fi Maps service features an administrator’s user interface in which you can select datasets that are displayed in the map window and that you can use to make a map publication. The administrator’s user interface also includes any previously published maps whose selected data layers and other settings you can edit.
Published map publications are downloaded from the server as embedded on the website when a user opens a page containing a map.
Basic functions
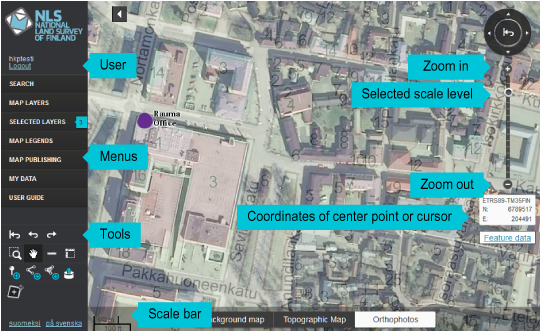
You can pan the map to a desired location by dragging the map or by using the arrows in the round arrow sign in the upper right-hand corner of the map window. When searching for a particular location, it is best to use Location Search.
You can zoom in and out to a desired scale step by stepwith the help of + and - buttons next to the scale bar or directly by using the scale bar. You can also zoom in and out with the scroll wheel of your mouse and zoom in by double-clicking the map.
Restoring default view. When you open the Map service for the public administration the first view that opens is the default view. If you are viewing a map that has been edited, you can clear the map at any time and return to the start view by using the function “Restore default view”; this function can be accomplished by clicking the middle arrow in the arrow sign in the upper right-hand corner of the map window.
The coordinates The coordinate tool is located below the scale bar on the right-hand side of the map view. By default, the tool shows the ETRS-TM35FIN coordinates of the centre point on the map. You can click on a point on the map to see its coordinates or you can enter coordinates manually. Click the Centre map button to define the coordinates you have entered as the centre point of the map view. Click 'Show mouse cursor coordinates' to change the coordinates according to the mouse cursor’s location. You can also add a marker to the point indicated by the coordinates by clicking ‘dd marker.
The index map shows in which part of Finland the map view is located. You can also embed an index map in connection with your map by using the function “Create map”. The index map can be shown and hidden in connection with the embedded map view by clicking the right lower corner of the map window.
Menus
In the Search menu, you can conduct a search by place name or directly pan to the desired location.
In the Map layers menu, you can search for datasets used in the service and select them for reviewing. They are sorted by theme and data provider. Data types:
• Vector level
• Raster level
The menu Selected Layers shows you what datasets the map view is currently showing. You can change the order of the map layers, adjust their opacity and delete them. The number of the layers selected in the window is shown next to the name of the menu.
The Legends menu includes a description of the map symbols used in different map layers, insofar as they are available.
In the Create map menu, you can publish the map view you have created and embed it on your organisation’s website.
In the Thematic maps menu, you can create thematic maps based on the datasets you have selected.
Your all objects and the maps you have published are saved in the My data menu. In this menu, you can also cancel a map’s publication. You can also access and edit your user information.
The User guide menu includes these instructions.
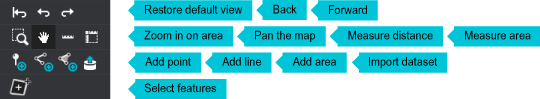
Note that when you edit a map view, you can always return to the default view, cancel your changes or redo them. These tools are available below the menus on the left-hand side of the page. Restoring the default view is the same function as the one activated by clicking the centre arrow in the arrow circle. You cannot return to the previous view from the default view.
Tools
Map views
Map views are created by using the map layers found in the menu Map Layers. If you have created your own map layers before, you can find them under the tab “By theme” --> “My layers“. The view can be finished off by using the functions in the menu Selected layers.
How to create a map view:
- Use the menu Map layers to view the map layers available.
- You can change the order of the map layers through the menu Selected layers and by dragging the layers into the desired order. If needed, you can also adjust the opacity of the layers.
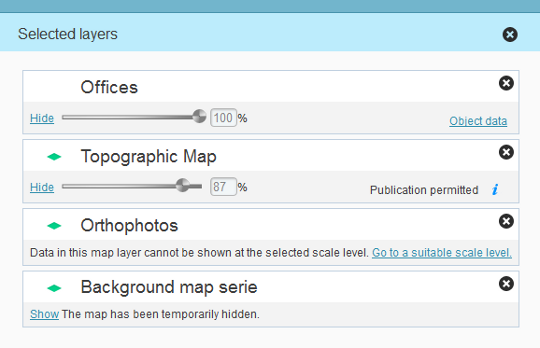
With the help of the menu “Selected layers”, you can hide, show and delete map layers, adjust their opacity and view the status of the maps.
Object data
If the map layer you have selected contains object data, you can show it with the help of the "Object data" link. The link opens a table that contains all objects within the area of the map view and their attribute data. You can save the table as a CSV or Excel file with the help of the "Export dataset" button in the top right corner of the table.
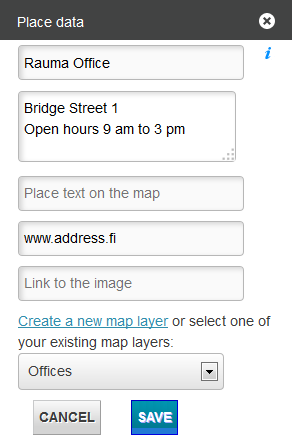
My objects
In Suomi.fi Maps, you can also add your own objects onto a map. An object can be a dot, line or area with a name and description. Once you have added an object onto the map, click ‘Save’ to save the object in one of your own map layers or create a new map layer. You can also edit and delete your own objects.
You can gather objects that have the same them together and present them in a similar way (presentation styles are determined by layer, not by object).
Where can you find your objects?
You can find your objects via the tab “Places” and its menu “My data”.
Viewing own objects
You can view your objects by clicking their names on the tab ”Places”.
Editing data concerning own objects
You can edit the data concerning your own objects by using the function ”Edit”.
Editing presentation style of objects
You can edit the presentation style of objects by using the function ”Edit layer”. Presentation styles are according to layer.
Deleting own objects
You can delete your own objects from map layers by using the function ”Delete”.
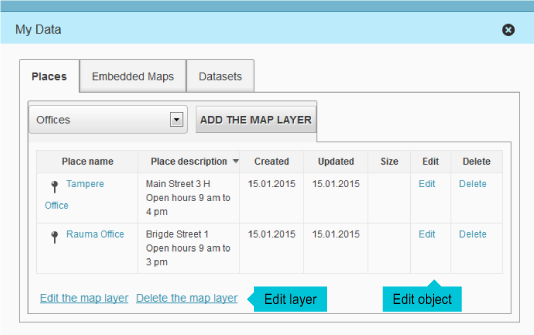
The objects that you have saved can be found on the tab ”Places” via the menu ”My data”. If you click the name of the object, the map view will pan to show the object in question.
My map layers
You can save your objects on your own map layers. When marking your objects on a map layer you can only use one presentation style. This way with the help of map layers you can separate different themes from each other. A list of “My map layers” can be found on the tab ”Places” under the menu ”My data”.
Creating new map layers
You can create new map layers by clicking ”Add layer” on the tab “Places”. If needed, you can also create a new layer later when saving or editing the object.
Viewing own map layers
You can view your own map layers by clicking ”My layers” in the menu ”Map layers”. Another way of viewing your own map layers is to choose the desired layer in the menu ”My data” on the tab ”Places” and click an object on it (the map view will focus upon the selected object).
Editing and deleting own map layers
You can edit the names of the map layers and their presentation styles by clicking “Edit layer” on the tab “Places”.
Embedding own map layers
You can embed own map layers by choosing them via the menu ”Map layers”.
My datasets
You can import your own spatial datasets into the Map service for the public administration. The dataset should be zip packed and have the file format gpx, kml/kmz, mid/mif or shp. The size of the dataset to be transferred has been restricted. The application alerts the user when the maximum limit has been exceeded.
Select the file that you want to import. Give the dataset a name, description and data source as well as define the presentation style for dots, lines and areas. Press "Send", after which the dataset is imported into the Map service for the public administration.
You can find your own datasets in the menu My Data on the tab Datasets and in the menu Map layers under Own datasets.
Publishing own datasets
You can publish own datasets by choosing them via the menu "Map layers".
My interface services
Your organisation’s interface services can also be linked to the Suomi.fi Maps service.
You can link your WMS, WMTS or WFS interfaces to the service. The interfaces can be intended for the customer only or for all users of the service.
When you want to link an interface to the Suomi.fi Maps service, contact us by using the contact form. In the 'Reason for contact' section, select 'Question or request for quidance.' In the 'My case concerns' section, select 'Suomi.fi maps'.
Indicate the following information in your message:
- Your name and organisation
- access rights (whether the interface will be made available to you only or to all users of the service)
- the URL of the interface service
- any username/password
- the map layers to be added (if the interface service includes several map layers/products, define whether all or individual levels will be added)
- for WMS services, also define whether the feature information query (GetFeatureInfo) will be activated for each layer
Also indicate
• the names of map layers shown in the user interface (Finnish/Swedish/English)
• the Paikkatietohakemisto service’s dataset identifier (i.e. the unique identifier given for the dataset in Paikkatietohakemisto)
Please note any service restrictions: The functioning of the interface cannot be guaranteed. In particular, WFS interfaces may not work properly.
How to publish an embedded map
You can publish maps on your website using the ‘Map publishing’ function. You can define the map view, the tools that will be shown with the map and their appearance. Once you have completed your definitions, you can publish the map by copying the map’s HTML code on your website.
Select ‘Map publishing’ in the menu on the left-hand side of the map window. The window lists all map layers available for publication.
To publish a map, the following information must be provided for it:
• Map name
• Language: select the language used in the map to be published.
• Website name: the website on which the map will be published (enter the name without ‘http’ or ‘www’). Not mandatory. If you only want to publish the map on a specific website, enter its URL here.
Map size
You can define the size of the map to be published:
• Full view: You can define a map window that is scaled according to the size given on the website.
• Small: The map’s width is 580 pixels and height 387 pixels.
• Medium: The map’s width is 700 pixels and height 600 pixels.
• Large: The map’s width is 1,240 pixels and height 700 pixels.
• Define your own size: The width can be at least 30 and at most 4,000 pixels. The height can be at least 20 and at most 2,000 pixels.
Map layer menu
The map to be published displays all map layers that were openly available when creating the map publication.
Map layers menu
- Select whether the map layer on the map to be published is a background map. If you select several background maps, the user can change the background map, if necessary. Only one background map can be displayed at the same time.
Layer presentation
- Changing the order of map layers: You can change the order of map layers by dragging them. This function is not available in maps that have already been published.
- Adjusting opacity: You can select how opaque the map layer is in the map to be published. This function is not available in maps that have already been published.

Tools shown on the map and their placement
Select the tools that are available in the map to be published.
• In your own placement, you can define where each tool is located in the map view. You can move the tools by dragging them from one box to another.
Layout
You can change your map interface’s colours, font types and tool styles.
• Colours: You can change the colours of object data, your own objects’ data and the map layer menu. You can define your own colours using the RGB colour codes.
• Font type: The font type used in the user interface can be Arial (sans-serif) or Georgia (serif).
• Tool style: You can choose from six different tool styles. The default style is the style used in the map service for the public administration.
Editing an embedded map
You can find the maps that you have published in the ‘Embedded maps’ tab in the ‘My data’ menu. Open the map that you want to edit by clicking the ‘Edit’ link next to the map. Make the changes you want in map settings and click ‘Replace’. The changes will be shown in the published map with a short delay. You do not need to copy the code and paste it again to your website.
Editing with the help of parameters
Certain modifications, such as changing language, can also be made with the help of parameters. Embedded maps can be edited with the help of the following parameters:
Language of the map
The root URL includes a language parameter which can be edited in order to the change the language of the embedded map. At the moment the supported language alternatives are:
- /fi/
- /sv/
- /en/
The other parameters are added at the end of the URL that is produced by the embedding function
Metric coordinates in ETRS-TM35FIN-form
- &coord=123456_1234567 (i.e. E and N)
- The coordinate E (east-west) has 6 figures and the coordinate N (north-south) 7 figures
Pointing the center marker
- &isCenterMarker=true/false
Centering a map with the help of address (requires all the parameters)
- &address=street name_address number_locality
- The address numbers may only contain numbers, e.g. address numbers of the type 4., 1-5 or 5a do not allowed because the NLS address number data are distributed at regular distances along each side of the road without the information about address numbers that include hyphens or letters.
Level of scale
- &zoomLevel=3 (values between 0-12, where 0 means the entire Finland and where 12 is the largest scale)
Thematic maps
Using the ‘Thematic maps’ function, you can create thematic maps for illustrating the regional variation caused by a specific phenomenon, for example. You can publish and embed the thematic map on a webpage in the same way as all other map views made using the service.
You can present dataset values by municipality, sub-region or region. Datasets are read in real time in data providers’ interface services. The thematic map layer will also be shown in the ‘Selected layers’ menu as a new map layer.
Create a thematic map
Select Thematic maps from the menu on the left. Click on Search data to select the data and their specifications.
Under Dataset search, you can select datasets and the specifications related to them.
1. Select the regional division (optional) you want to use to review an indicator. You can select several regional divisions. To deselect, click a selected division again. Accept your selections by clicking ‘OK’ or cancel them by clicking ‘Cancel’. The regional division filter determines which data sources are available. Some data sources cannot be used with all region sets.
2. Select the data source in the drop-down menu. You can choose from data in the Sotkanet interface service maintained by the Finnish Institute for Health and Welfare, and the National Land Survey of Finland’s Statistical information service for property transactions. By selecting the option Your indicators, you can specify statistical data for the thematic map either by giving them manually or by using an Excel-file, for example.
3. Select the indicator you want to review. You can search for indicators by entering a search term in the text field by selecting one in the drop-down menu. You can select several indicators by ticking the box in front of an indicator’s name, after which the selected box will be highlighted in green. To deselect, click a green box again.
4. If you have selected the option Your indicators, the button Add new indicator will let you input the indicator data.
5. After this you can specify the contents of the data by using the selection options. The selection options depend on the data source.
6. Once you have made your selections, click ‘Search’.
You can also use the Time series function. This allows you to review an indicator as an animation over the interval you have selected. Select the time series at the top of the Seach data box, then click Get contents of data again.
Now the results can be reviewed on the map.
You can change the map’s style and layout. You can also change the indicator.
Classification and layout
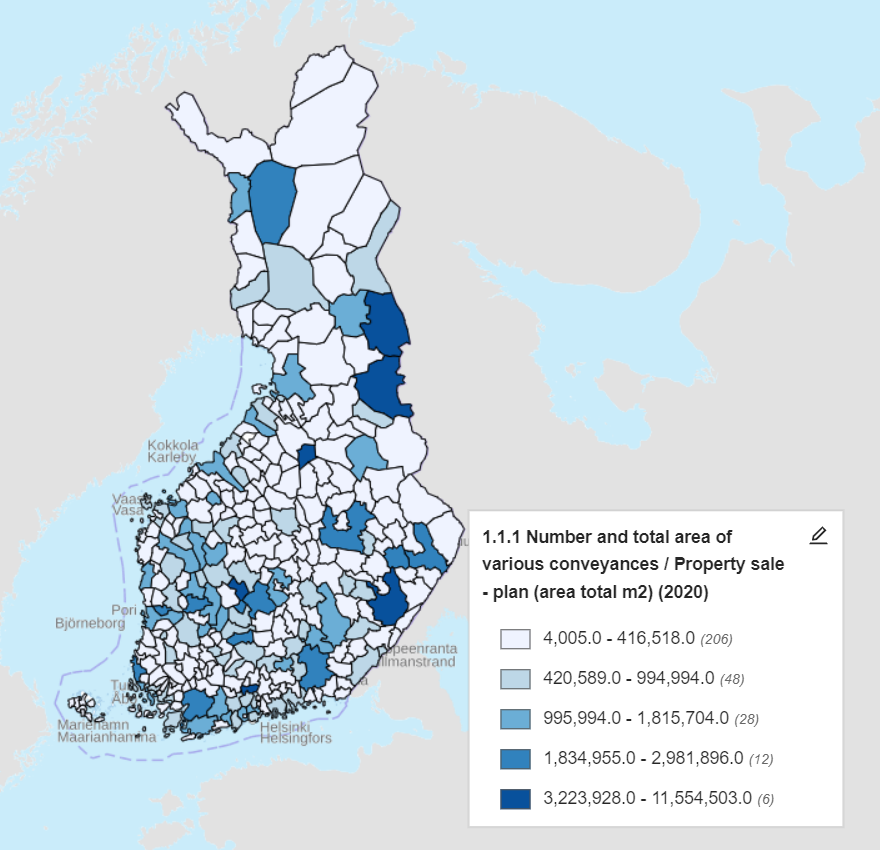
There are two map styles; a choropleth map and a point symbol map. On the choropleth map, each region is shown in an even colour matching its class, the point map shows a circle symbol whose size matches its class.
You can change the style and layout of the map by clicking the pen icon in the map legend box. You can also change the indicator. In the pop-up window, you can select the classification method and classification colours.
You can define a classification for datasets and set classification-specific colours. The classification is defined on the basis of the classification method, the number of classes and the continuity of class boundaries. Colour distributions can be quantitative, qualitative or distributed, depending on the indicator.
Change the classification
You can choose from four different classification methods:
• Natural boundaries: The classification is based on natural boundaries.
• Quantiles: Each class includes an equal number of observations.
• Even distribution: Classes are distributed evenly.
Any integer between 2 and 9 can be selected as the number of classes if the classification method is natural boundaries, quantiles or even distribution.
Class boundaries can be either continuous or discontinuous. Discontinuous class boundaries determine classes based on actual values, whereas continuous class boundaries determine classes so that they extend from one class to the next.
You can choose between the following distributions:
- Quantitative: A quantitative color distribution is used when the selected indicator is quantitative, i.e. depicts a numeric characteristic of the object. Such characteristics are e.g. age, height and percentage value. The darker the shade of an object is, the higher the value of the indicator is there. The colors of classes depicting e.g. percentage values could be white (0–25), yellow (26–50), orange (51–75) and red (76–100).
- Qualitative: A qualitative color distribution is used when the selected indicator is qualitative, i.e. depicts a non-numeric characteristic of the object. Such characteristics are e.g. color, nationality and region. Each class has its own color. When depicting e.g. regions, the colors could be blue (Uusimaa), red (Ostrobothnia) and yellow (Southwest Finland).
- Diverging: A diverging color distribution is used when the selected indicator is relative and depicts e.g. change or difference from zero. Such characteristics are e.g. temperature, change in population and height above sea level (if depth data is included). The color alters according to whether the indicator value is negative (lower than zero) or positive (higher than zero).
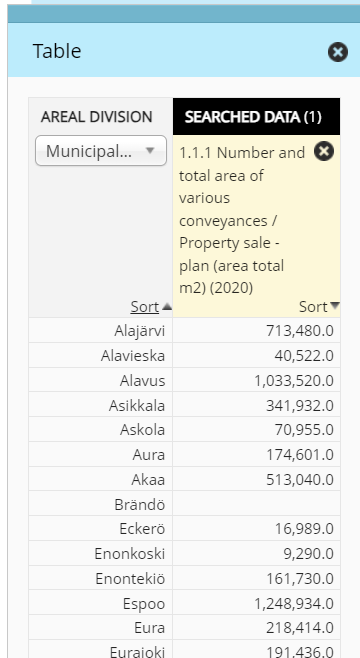
Dataset data in a table
You can also look at the thematic map data in table form. In the menu on the left, select Thematic Map and then select Table. In the table, you can review dataset values based on the regional division. You can select municipalities, sub-regions and regions as the regional division.
You can arrange dataset values and the regional division in ascending or descending order by using the Sort buttons.
If required, you can create several thematic maps for comparisons by selecting more datasets in the ‘Dataset search’ menu. You can change the displayed thematic map by clicking the dataset’s name in the ‘Thematic maps’ window, after which the selected dataset will be shown on a yellow background. Tick the box in the top corner of the dataset to deselect the dataset.
Your indicators
If you want to create a thematic map using other statistical data than that which is already available in the data sources menu, select Your indicators in the Search data box. In the Select data drop-down menu under the heading Indicator, previously saved indicators are shown. If there are no saved indicators yet, select the Add new indicator button.
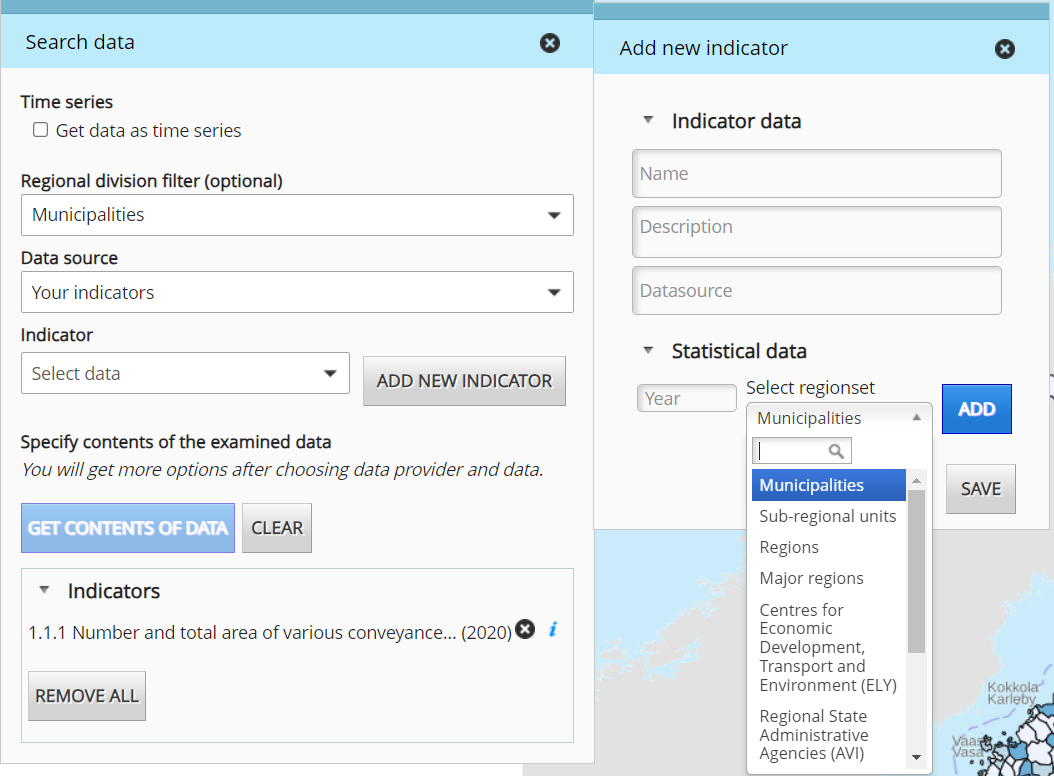
Give the necessary indicator data. Select the region set that matches your statistical data. The next window will show a table that matches your region set.
If your own data source (for example an Excel-file) has matching regional names in the same format as the thematic map function, you can import the data by using the button Add. The imported data must be in the following format: Regionset;value. You can also manually type the values in the table. Click Save to create a thematic map based on the values you have given. At the same time, the indicator is saved for later use.