When you log in to Paikkatietoikkuna, you can save map views to your account, create new places and download them to your computer, create embedded map and thematic map indicators, create your own styles and upload datasets. All of these are available under My Data.
Return to Instructions of Paikkatietoikkuna -website.
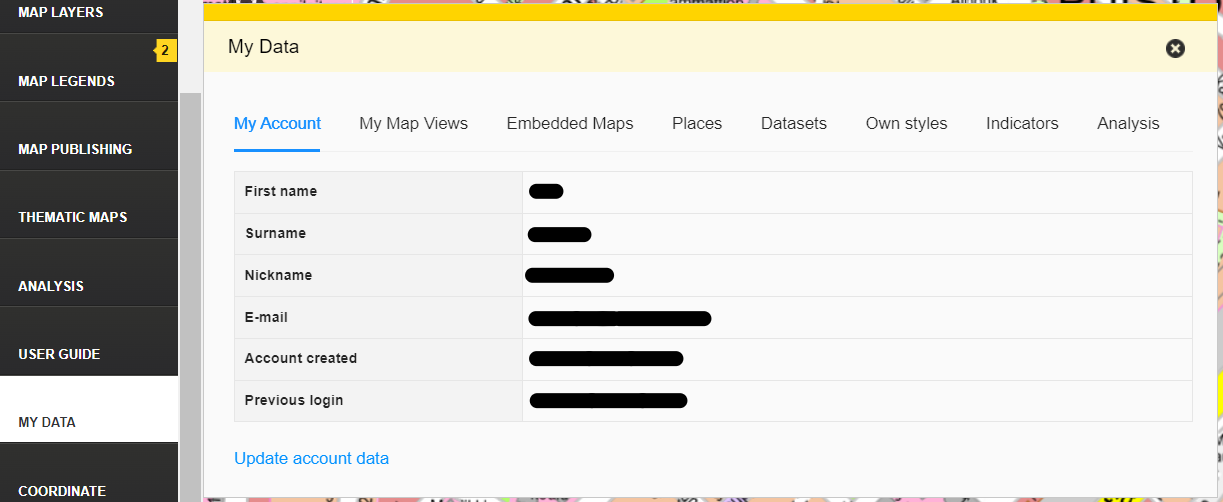
My account
The My Account tab shows you which name, nickname and email address your ID was created with. It also shows when your account was created and your last login. You can update your data by clicking “Update account data”. You will be redirected to log in to the National Land Survey of Finland’s My Account service (Omatili), where you can update your data after you have logged in.
If you would like your data to be transferred to another email address, please contact us using the feedback form before creating a new account in the My Account service (Omatili). On the feedback form, select at field "My case concerns" The Finnish Geoportal Paikkatietoikkuna.
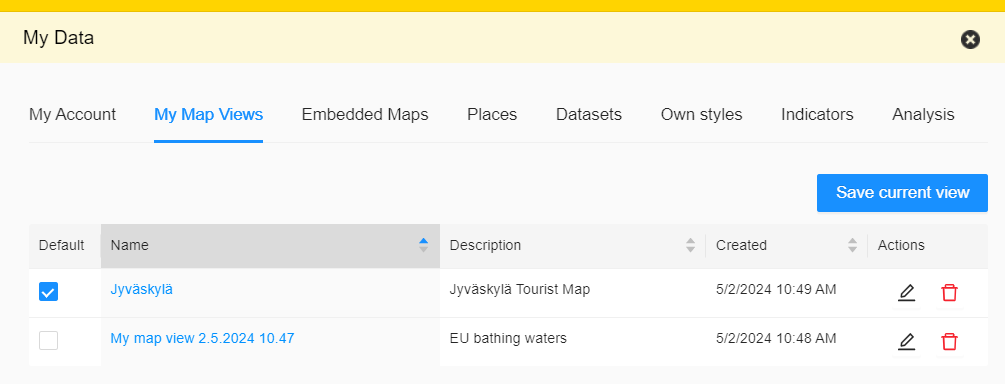
My Map Views
On the My Map Views tab, you can view the map views you have saved. By clicking the name of a view, it will open in Paikkatietoikkuna. You can filter the maps by name, description and creation date by clicking the names of the columns. If you want Paikkatietoikkuna to open to a certain view, you can select it as your default view by clicking the box in the Default column. Use the tools in the Actions column to edit the information of the map view (pen icon) or delete the map view (waste bin icon).
You can save the map view with the “Save view” tool (camera) or by clicking “Save current view” on the My Map Views tab. Give the map view a name and a description. Click the box under “Default” if you want the map view to open as default when you log in to Paikkatietoikkuna.
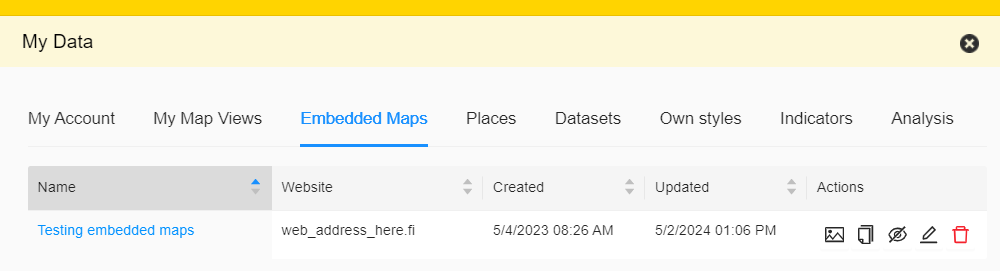
Embedded maps
The Embedded Maps tab shows your saved embedded maps. Instructions for creating an embedded map.
On the Embedded Maps tab, you can use the Map publication function to see your maps embedded on other websites. You can filter the maps by name, website, creation date and updates by clicking the names of the columns. When you click the name of an embedded map, the map will open in a separate window.
In the Actions column, you can open an embedded map in the Paikkatietoikkuna map view (image icon), copy the map’s HTML code (copy icon), cancel the publication of the map or republish it (eye icon), edit a published map (pen icon) and delete a published map (waste bin icon).
Places
In Paikkatietoikkuna, you can save point-, line- or area-shaped places. Instructions for adding places.
In the Places tab, you can see the places you have saved by map layers. Start by selecting your map layer from the Map Layers dropdown menu. You can see the places saved on the map layer in question in a table under the menu.
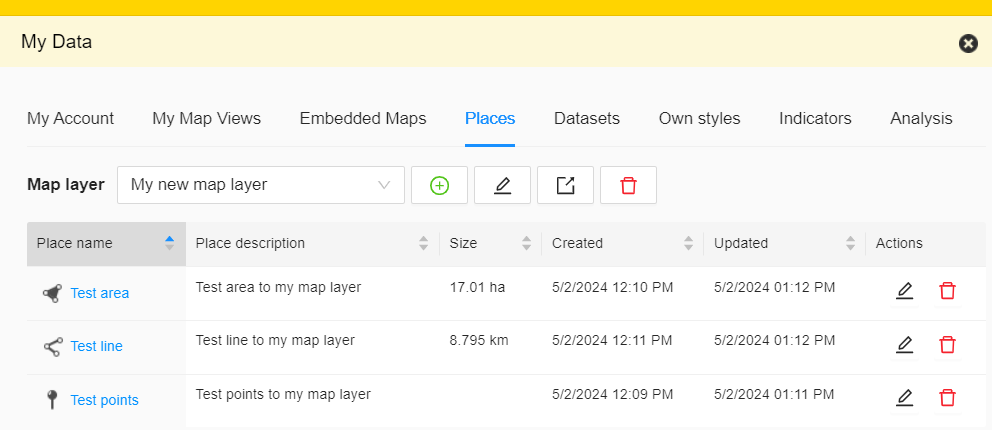
Editing a map layer
Use the buttons next to the Map Layer dropdown menu to create new map layers (plus icon), edit the information of a map layer (pen icon), save places on a map layer to your computer as GeoJSON (arrow icon) and delete a map layer (waste bin icon).
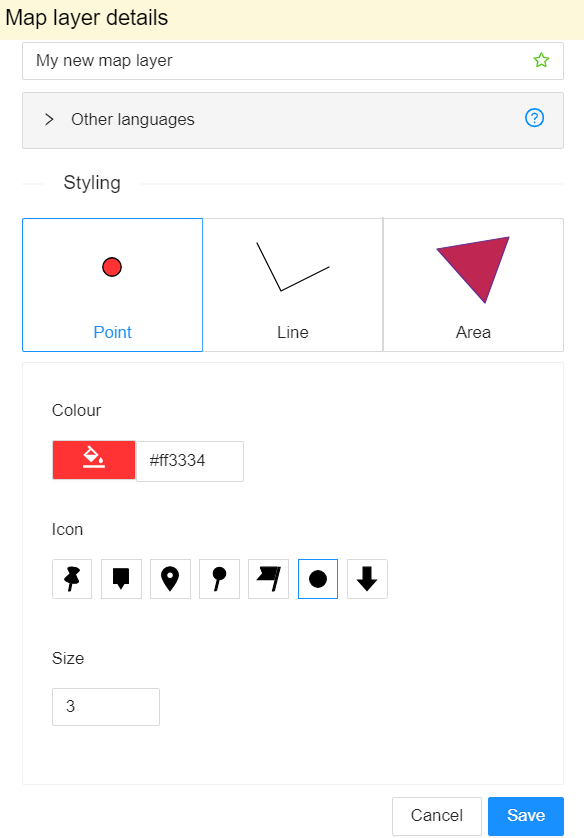
The add and edit buttons open a new window where you can edit the information of the map layer. Give the new map layer a name in Finnish and, if you want, in Swedish and English. In addition, you can edit the map layer’s styles for points, lines and area-like places.
After the deletion of a map layer, Paikkatietoikkuna will ask you whether you want to remove places saved on the map layer as well or move them to another map layer.
Editing places
You can see a place in a map view when you click its name in the places table. By clicking the column names, you can sort the places by name, description, size, creation date or update.
You can edit places by clicking the pen icon. This will zoom in on the place in a map view and open a window on top of the view where you can edit the information of the place or transfer it to another map layer. You can edit the place’s shape and location in the map view. You can move points or edit the line and borders of a place by hovering your mouse on top of a point, line or area, after which you will be able to edit the place by dragging.
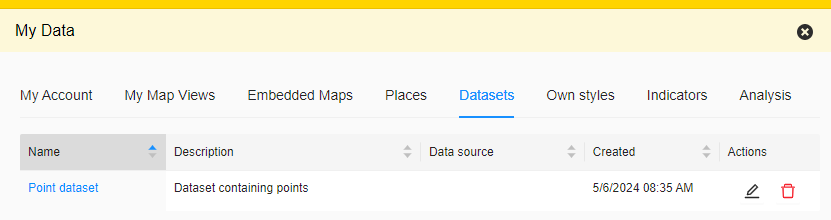
Datasets
You can see the datasets you have added to Paikkatietoikkuna on the Datasets tab.
You can edit information of a dataset by clicking the pen icon. On the General tab of the pop-up window, you can edit the name, description and source of your dataset. On the Visualization tab, you can edit the styles of your datasets.
You can also remove a dataset by clicking the waste bin icon.
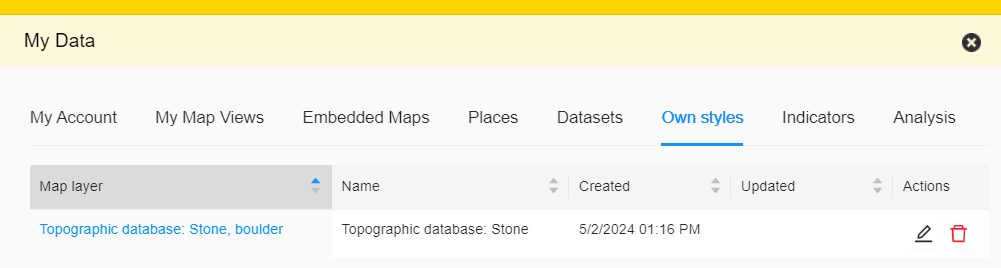
Own Styles
On the “Own Styles” tab, you can view, edit and delete styles you have saved.
How to create a style on a map layer:
- Select a map layer in the Map Layers menu that you want to create a style for.
- Click to open the “Selected Layers” tab in the Map Layers menu.
- On the right side of your desired layer, click the pen icon and edit the layer’s style by changing its colour, the shape of the corners and line style.
- Once you click save, the style you created will show up on the “Own Styles” tab under “My Data”. You can create several styles for the same layer.
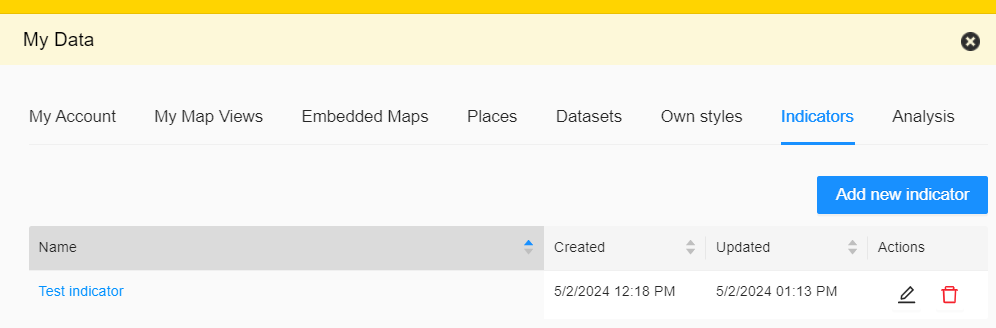
Indicators
The Indicators tab shows the indicators you have created.
You can edit the information of an already created indicator by clicking the pen icon or delete the indicator by clicking on the waste bin icon.
You can also create a new indicator by clicking “Add New Indicator”. On the “Indicator Data” tab on the pop-up window, you can give the indicator a name, description and source. On the Statistical Data tab, you can add the year related to the indicator and select the regionset in the drop-down menu. By clicking Add, you can add statistical data for the indicator. Click Save to save the information you have entered.