Would you like to add map layers to a map view in Paikkatietoikkuna? Read this guide to know how to add map layers, change the settings for map layers and make feature data related to the map layer visible.
Return to Instructions of Paikkatietoikkuna -website.
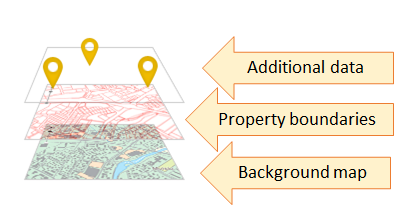
Figure. You can show several map layers on top of each other and create a totally new view.
Add map layers to a map view
The map layers available can be found in the Map Layers menu. Search for map layers using one of the following methods:
- Browse map layers according to theme.
- Browse map layers according to data producer. The data producer is the organisation producing the map layer.
- Type a search term in the search field. The search term can be the name of a dataset or a data producer or a keyword. You can replace the end of a search term with an asterisk (*).
To show only part of the map layers, click the buttons on top of the pop-up window.
- Newest: The latest updated map layers
- Vector layers: Map layers containing feature data and to the features of which it is possible to perform spatial data analyses.
- Publishable: Map layers that can be used in embedded maps published using Map Publishing.
All map layers are followed by the following icons:
| Availability: If the icon is green, the map layer is currently available. | |
| Map layer type: The type of map layer. Possible types have been described below. | |
| Additional information: Link to metadata describing the map layer. The metadata shows, for instance, the coverage, updating frequency and data contents of the map layer. |
There are different types of map layers:
| Map layer (WMS): Map layer consisting of map images | |
| Map layer (WMTS) | |
| Data product (WFS): Map layer containing feature data | |
| Indicator (statistics): Map layer containing statistical information used via the Thematic Maps function. | |
| Analysis layer: Map layer containing data retrieved as a result of analysis. You can create analysis layers by using the Analysis function. |
Selected layers
In the Selected Layers menu, you can see the map layers you have selected and change their settings and order.
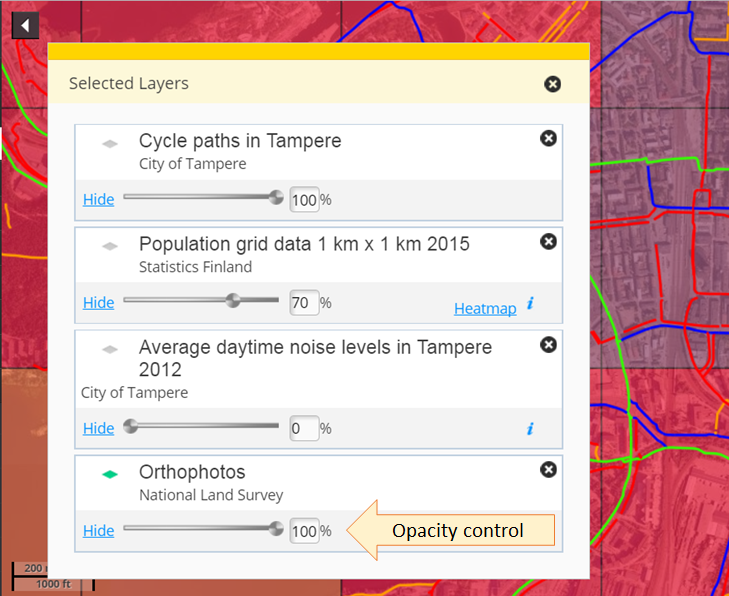
Figure: The settings of the selected map layers are shown below the name of each layer.
The selected map layers are listed in a list where the topmost map layer of the map view is on top. You can change the order of the map layers by dragging them up and down in the list. By adjusting a map layer's opacity, you can control whether the map layers underneath the map layer in question are visible through it. In addition, you can select the style for some map layers. You can also hide or show desired map layers.
In the Selected Layers menu, you can check whether a map layer you have selected can be published on your website by using the Map Publishing function.
Feature data
If the data product (dataset) contains feature data, you can view the feature data of the data product via the Selected Layers menu.
It is possible to view feature data also via the Feature Data link below the zoom bar. Moreover, it is possible to view the data of a particular feature by clicking the location on the map. The pop-up window shows the location's attribute data of all selected map layers containing feature data.
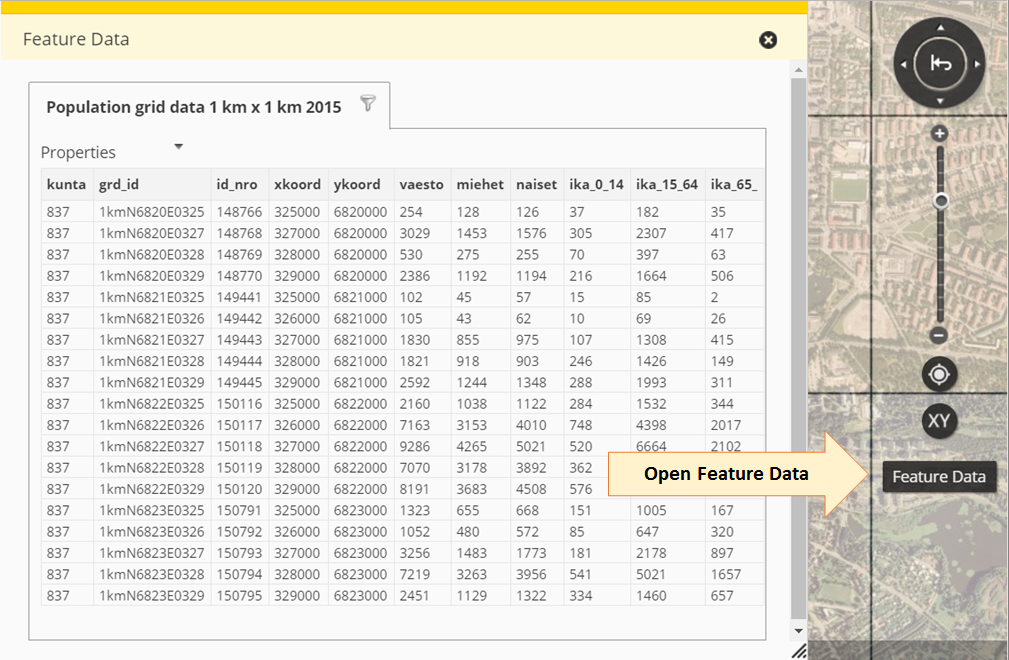
Figure. The feature data of the selected map layers are shown in a table which you can open by clicking the Feature Data button on the right on the map view.
The tabs of the feature data table contain all selected map layers containing feature data. The table contains all features and their attribute data that are visible in the map view of the map layer. You can sort the data of the features by clicking the column title.
You can select features by clicking them either on the map or in the table. Selected features are highlighted in yellow in the table and on the map. You can select several features at the same time by holding down the CTRL key while clicking the features.
You can save the feature data on your own computer either in an Excel table or a CSV file. Click "Export dataset", select the desired options and finally click "Export".
Map Legends
You can see the map legends for selected map layers in the Map Legends menu. The map legends show the map symbols and colours used. Click the i icon to see the metadata of the map layer. Map legends are available only for some of the map layers.
Heatmap
With the help of a heatmap you can visualise how the feature density varies in different areas weighted by specific attribute data.
In Paikkatietoikkuna, the heatmap function is available for instance for the following WMS map layers provided by Statistics Finland (marked with a symbol in the map layer listing):
- Population grid data 1 km x 1 km (as centroids of grid cells)
- Road traffic accidents
- Educational institutes
Let us take Road traffic accidents as an example. The image below shows a heatmap depicting the number of road traffic accidents in different areas. Areas with a high number of accidents are coloured yellow. Areas with a lower number of accidents are coloured red. Areas with only a few accidents are coloured blue. Areas with no accidents are not coloured. Accident sites are marked with triangles.
To start using heatmap in Paikkatietoikkuna, do the following:
- Select an appropriate map layer from the map layer list.
- Open the map layer in the Selected Layers list and click Heatmap.
- Define the heatmap settings (see below) and click OK.
- The heatmap is visible on the map. You can use it like other map layers.
Heatmap settings:
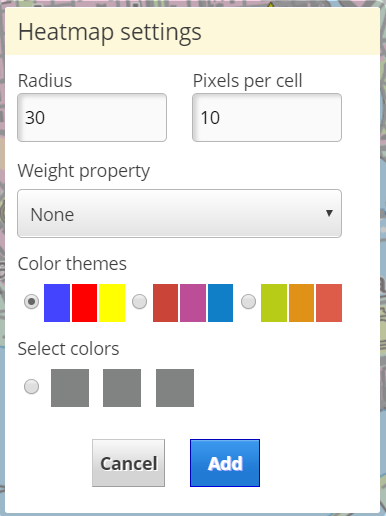
- Radius: Distance where features are searched. Enter the distance as pixels.
- Number of pixels per cell: Resolution for heatmap calculations. The default value is 1. Bigger values improve the performance, but smaller values allow a more accurate visualisation.
- Weighted property: Select one property to be used in the heatmap. You can find the explanations for properties in the metadata.
- Colour themes: Select the colour theme to be used in the heatmap. The colours to the right are used to visualise areas with the highest feature density. The colours to the left are used to visualise areas with the lowest feature density.
- Select colours: Select this option, if you want to define the colour theme yourself. Click the squares to select the colours to be used.