Mapping and Change Analysis Applications with Multiple Scale Remote Sensing
The Mapping group develops automatic methods to interpret remote sensing and Earth observation data and their changes. The group uses several, different scale, data sources including satellite data and dense laser scanning point clouds. The main study aim of the group is to improve the efficiency of mapping applications, map updating, and land use monitoring by combining data from different sources and increasing their automatic processing.
The group exploits several different data sources in its research, including open Earth observation data (ESA Sentinel-2), state-of-the-art multiwavelength laser scanning data (Optech Titan), and datasets collected with in FGI developed UAV and mobile mapping platforms (NLS Roamer).
The data interpretation techniques include object-based approaches and efficient classification and machine learning algorithms. The group also tests open processing software and aims to promote their use in analysis.
Present remote sensing data sources
European Space Agency’s Sentinel data
All human actions have effect on our living environment and its development. To understand the effects, up-to-date information is required from the environment and changes in it. Earth Observation data obtained from satellite platforms provide an excellent tool to this aim. European Space Agency’s (ESA) Sentinel Earth Observation platforms produce a constant stream of multiple channel imagery and radar data on weekly intervals for this purpose. The Sentinel data are of societal importance as they are openly available both for public and private purposes. The satellite data have a wide coverage and new imagery is provided on weekly basis. Rapid update frequency allows continuous and highly automatized change detection, monitoring and interpretation all over Finland. When finding changes on local level, the change information can be combined with other open geospatial databases provided by National Land Survey of Finland and other public organizations to create models about regional changes.
The Mapping research group investigates new methodology and open source tools with the aim to ease the adoption of novel satellite data sources and widen their their exploitation.
Multiwavelength airborne laser scanning
Multiwavelength airborne laser scanning (ALS) is one of the most promising new techniques in renewing map updating routines. The multiple wavelength ALS combines most of the best properties of the present single wavelength laser scanning and airborne imaging: it is an active data collection technique that gives 3D information of the area of interest, which are prerequisite for creating ground and surface models. Moreover, the multiple wavelength data simplifies the tasks of individual object segmentation and their correct classification.
The Mapping group studies the potential of multiple wavelength ALS with using the data obtained with the first commercial multiple wavelength ALS system, Optech Titan. The system collects data simultaneously with three separate wavelengths thus making the map updating processes faster and increasing their reliability.
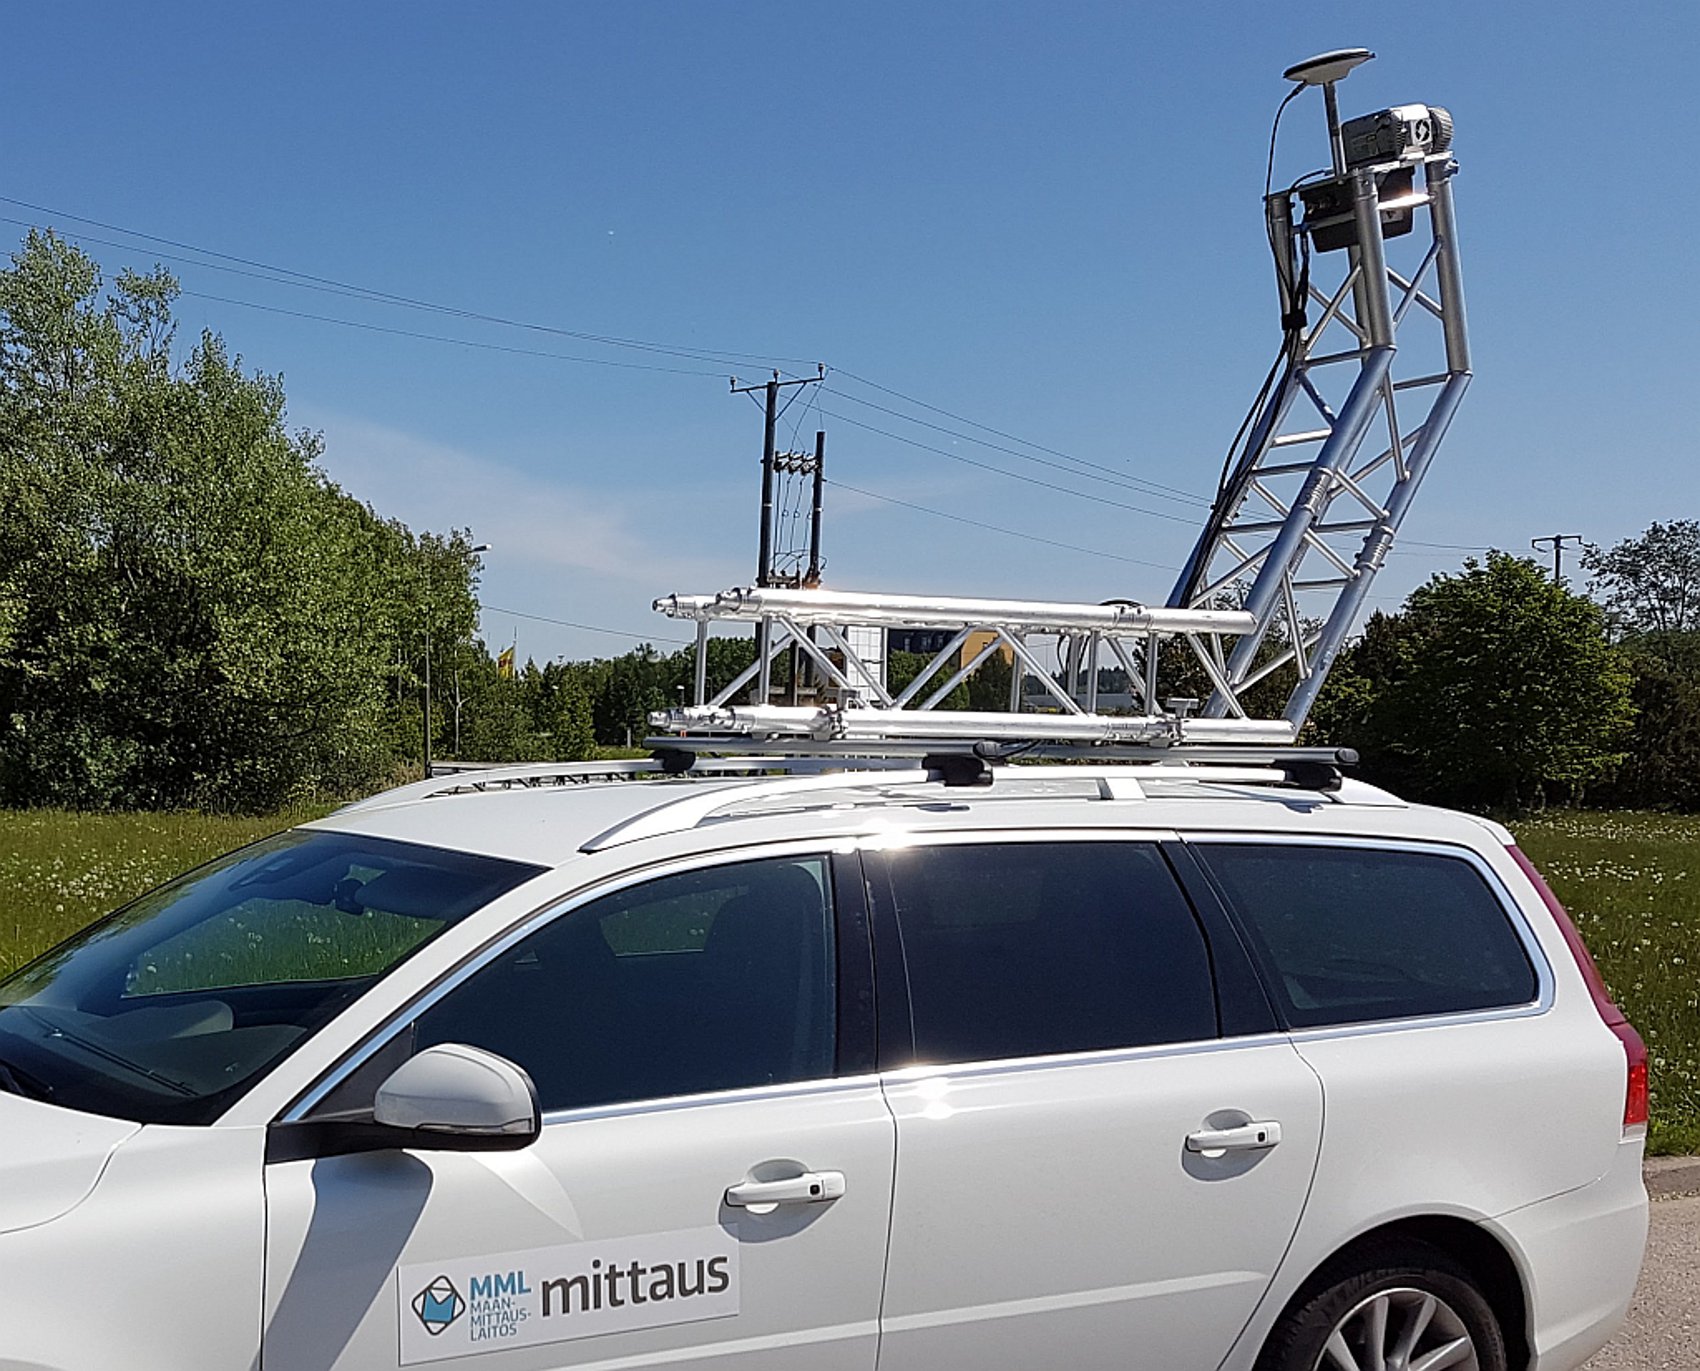
Mobile mapping platforms
Earth observation systems and airborne platforms are effective in covering large areas to update their information. Both techniques observe the areas of interest directly from above or with small viewing angles, which results in gaps in data due to occlusions or shading in the study scene. These effects limit the usability or satellite and airborne systems in some environments, like in densely built urban areas. In such areas, map updating processes can be supported by collecting additional data with mobile mapping platforms, like low-flying UAVs or FGI developed Roamer system.
Mobile mapping systems produce high density 3D information around them and their wide view angles allow detailed mapping and documentation of vertical structures, like building facades or street furniture.
By combining all obtained mapping data from different platforms, it is possible to develop accurate city models for different purposes, including change detection, virtual urban environments, or city climate.
ROAMER R3
Research applications
Buildings
Buildings are one of the most important object groups in map updating. They are also preferred targets in automated interpretation tasks as they are detected with high accuracies from present laser scanning data and aerial imagery. FGI has done research on building detection for over a decade both by developing new methodology and by the methods on different areas and with different datasets. The studies have shown that majority of buildings are detectable with automatic methods that provide valuable change detection information on new, demolished and changed buildings.
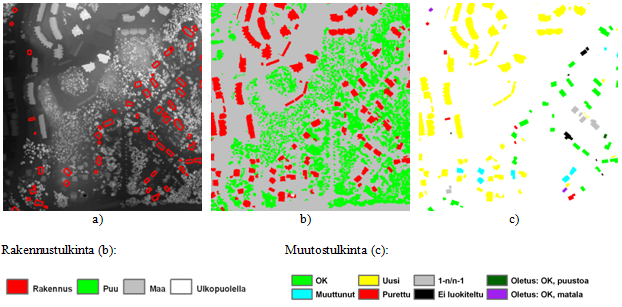
a) A digital surface model created from laser scanner data and old building vectors, b) results of automatic building detection, c) results of automatic change detection. Buildings of the old map © The National Land Survey of Finland 2001.
Field parcels
One of the Mapping group’s study focuses is on field parcel monitoring. The group develops automatic techniques for field parcel change detection to update change information in existing field parcel maps. The group uses mainly aerial imagery and ALS data to find the altered field parcels, but is also testing and implementing the novel open satellite data to improve the continuity of the automated update process.

Automatically detected changes inside field parcels (outlined in red colour). Map and aerial image data © the Agency for Rural Affairs and aerial images suppliers.
Land use / land cover
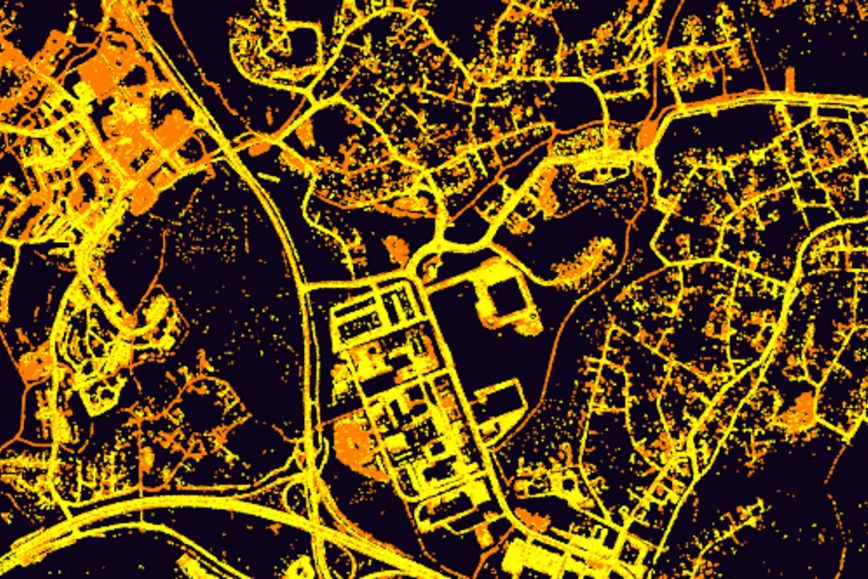
The group has long experience in land use and land cover classifications from several different data types. These include synthetic aperture radar (SAR) imagery, aerial imagery, airborne laser scanning data and optical range Earth Observation data. The research has been concentrated on object-based classification techniques that have been shown to give high accuracy classification results when applied on verified datasets. The result quality has been verified to be high both in visual and quantitative inspection. Especially the latest studies with multiple wavelength ALS data have shown their high potential for mapping applications. Multiple wavelength ALS is also suitable for detailed classification tasks in urban areas where it has been shown to have high performance in detecting buildings, trees, and several different land cover classes like gravel, bedrock, and low vegetation. The technique works also on mapping paved surfaces i.e. parking lots and roads.

Results of automatic land cover classification. Multitemporal interferometric SAR data were used in the classification. Classes: forest, open area, built-up area (three classes according to building density), water mask, missing data. SAR data and water mask © M. Engdahl.
Automatically classified land cover types from multiple wavelength Optech Titan ALS data.
Object-based classification
FGI has been working with object-based classification techniques since 1990s. These techniques are based on inspecting connected objects or segments instead of individual pixels. The objects and segments are created from an image, map information, or their combination. The objects can be classified based on detailed, operator defined features, but at present the classification can be performed increasingly with automated techniques that utilize machine learning and higher computational power.

Segmentation of a Landsat TM satellite image into homogeneous regions (Figure from the report: Matikainen, L., Yu, X., Kuittinen, R. and Ahokas, E., 1997. Updating topographic maps by using multisource data and knowledge-based interpretation. Reports of the Finnish Geodetic Institute 97:1.).

Snow cover percentages of drainage areas on 20 April 1999 estimated from a NOAA AVHRR satellite image. Drainage areas © Finnish Environment Institute. (Figure from the report: Matikainen, L., Grandell, J., Kuittinen, R. and Vepsäläinen, J., 1999. Snowmelt monitoring using multisource satellite image and ground measurement data. Reports of the Finnish Geodetic Institute, (99:8), 46 p.). Further information on the method: Matikainen, L., Kuittinen, R. and J. Vepsäläinen, 2002. Estimating drainage area-based snow-cover percentages from NOAA AVHRR images. International Journal of Remote Sensing, Vol. 23, No. 15, pp. 2971-2988. http://www.tandfonline.com/doi/abs/10.1080/01431160110071923
More information: Remote sensing electronics
Contact persons
Members
Departments